
Data Sources
Data displayed on the PFAS Maps are based on the California Water Boards PFAS Sampling Results dataset. PFAS sampling results from the Unregulated Contaminant Monitoring Rules (UCMR3) dataset are also displayed in the first map. Data from sampling stations are linked to locations of Water System Service Areas by matching the Public Water System Identification (PWSID) number found in each dataset. If the Water System Service Area was not available, data from the sampling station were displayed based on the geographic coordinates of the sampling location.
California Water Boards PFAS Sampling Results Dataset
Under California's Safe Drinking Water Act, the Division of Drinking Water ordered some water systems to test for up to 18 types of PFAS. Beginning April 2019, the selected water systems monitored and reported PFAS sampling results to the State Water Resources Control Board.
Public water systems that were within one mile of municipal solid waste landfills, two miles of airports with fire training and response sites, and one mile of previously contaminated water systems tested under UCMR3 were monitored during the first phase of sampling.
Due to continued monitoring, PFAS levels displayed may not reflect current levels and are subject to change as sampling continues.
US EPA UCMR3 Dataset
Under the Unregulated Contaminant Monitoring Rules, US EPA collects data for chemicals that are suspected contaminants in drinking water but do not have health-based standards set under the Safe Drinking Water Act. From 2013-2015, the Third Unregulated Contaminant Monitoring Rule (UCMR3) required some water systems to test for 6 types of PFAS.
Around 450 public water systems serving more than 10,000 people, and a selection of systems serving 10,000 or fewer people, were monitored in California during a 12-month period between January 2013 - December 2015.
Methods
Measuring PFAS in Drinking Water
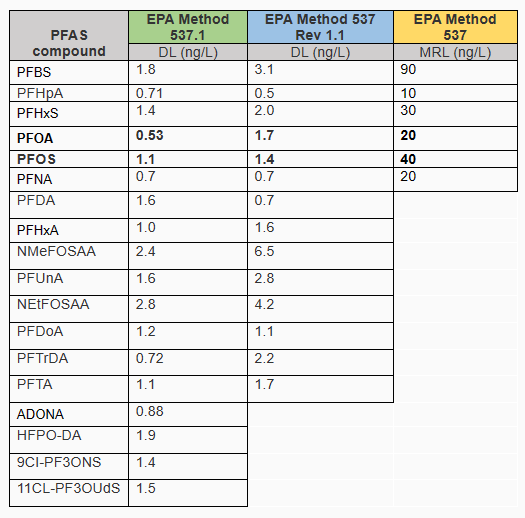
Several EPA methods for measuring PFAS are used to test drinking water. UCMR3 sampling used EPA Method 537, which tests for 6 types of PFAS. California Water Boards sampling uses either EPA Method 537 Rev 1.1 or EPA Method 537.1, which tests for 14 and 18 types of PFAS respectively.
It is important to note the different Minimum Reporting Levels (MRL), also known as Detection Limits (DL), used to measure PFAS. Any PFAS measurements below these levels are considered undetected (i.e. 0.00 ng/L) depending on the EPA method used. Thus, the frequency of PFAS detections varies between the UCMR3 sampling (2013-2015) and the California Water Boards sampling (2019-2020) based on the detection limits and types of PFAS measured.
Each public water system (PWS) has multiple sampling results for each type of PFAS at different locations within the PWS (called sampling stations). All sampling results are averaged by PFAS type and by sampling station within each PWS. Then, average concentrations by sampling station are averaged across all sampling stations within each PWS. This results in one average concentration value for each PWS for each PFAS type. Minimum and maximum values for all PFAS types are derived by taking the lowest and highest sampling results for each PWS.
Suggested Citation
Please use the following citation when using mapping results in reports or other materials:
Tracking California, Public Health Institute. PFAS Maps. Accessed from www.trackingcalifornia.org/data-and-tools/pfas [Date Accessed].